Author: Flora Weissgerber

  • Fully funded PhD opportunity – SAR and Altimetry synergy by deep-learning for sea-ice thickness mapping

    PhD supervision
    Flora Weissgerber (ONERA, DTIS, SAPIA)
    Florence Tupin (Télecom Paris – LTCI,  Institut Polytechnique de Paris)
    Sara Fleury (LEGOS, CNRS)

    Start date October 2025

    PhD description
    Arctic sea-ice extent has been decreasing since the 90’s, which speeds up the warming of the Arctic ocean since sea-ice insulates the ocean from the atmosphere and has a high albedo reducing the absorbed heat. To model this processus at a fine-scale, high resolution maps of sea-ice thickness are needed. The sea-ice thickness maps are currently produced from altimetric sensors such as SIRAL on board CryoSat-2 [Laxon2013, Kurtz2014] or AltiKa on board Saral [Zakharova2015], that measure elevation points of the sea-ice floes and the leads along the satellite track, leading to a very sparse spatio-temporal coverage. For instance,  to get a full Arctic coverage a month of data is needed (http://www.cpom.ucl.ac.uk/csopr/seaice.php). Thanks to the new mission SWOT, launched by CNES and NASA, 3D images of sea ice have been available since 2023. Its ATLAS swath-altimeter provides the topography of the sea ice over a width of 120km with a horizontal resolution of 250m (https://www.aviso.altimetry.fr/en/news/idm/2024/mar-2024-sea-ice-as-seen-by-swot.html). However, its recent launch means that it is not yet possible to reconstruct the evolution of the sea ice under the effect of global warming.
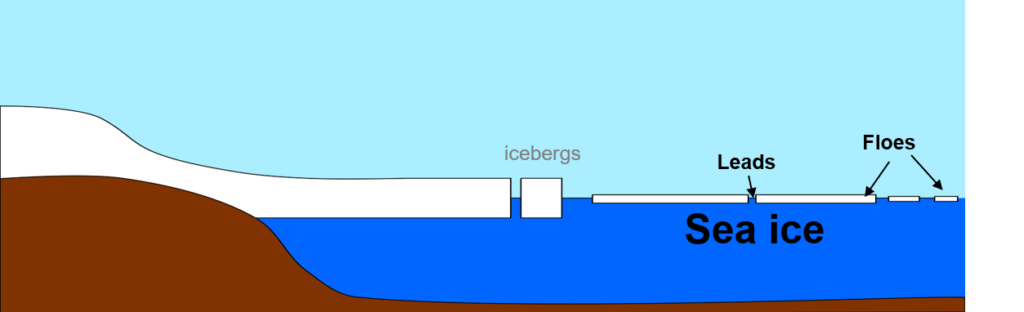
    Schematic illustration of sea ice with leads and floes.

    In this PhD, part of the SITEMSA ANR project, our goal is to obtain SWOT-like altimetric measurement by combining nadir altimetry measurements with Sentinel-1 (S1) SAR images. These images have a spatial resolution of 10 to 50 meters but don’t directly measure sea-ice thickness. However, they are used to map sea-ice types [Park2020]. Building on the link between sea-ice thickness, its roughness and the roughness measured on SAR images, they have already been used to extrapolate altimetric measurement at a basin scale [Karvonen2022]. By applying such a link locally, and building on the deep-learning advances, we aim to extend the altimetric measurement over a few hundred meters guided by the SAR images. To do so, multiple research questions are raised : 

    • Is it possible to get a sea-ice floes/leads mapping at the native resolution of SAR images? 
    • Can we build on this map to produce sea-ice elevation maps with only few regression points available?
    • Can temporal data be used to robustify the sea-ice elevation maps?

    Having labels for a sea-ice floes/leads semantic segmentation sea-ice mapping on SAR images is challenging. Optical images can be used to provide labels by ice-floe segmentation [König2020], but only few cloud-free Sentinel-2 (S2) multispectral images are available per year to get the pixel-based sea-ice floe labeling. Moreover, since the two images are not acquired at the same time, a sea-ice drift compensation will need to be applied and uncertainty in the label taken into account. An example of two pairs of S1 and S2 images acquired on the same day, separated by 1 day is shown in the following figure.
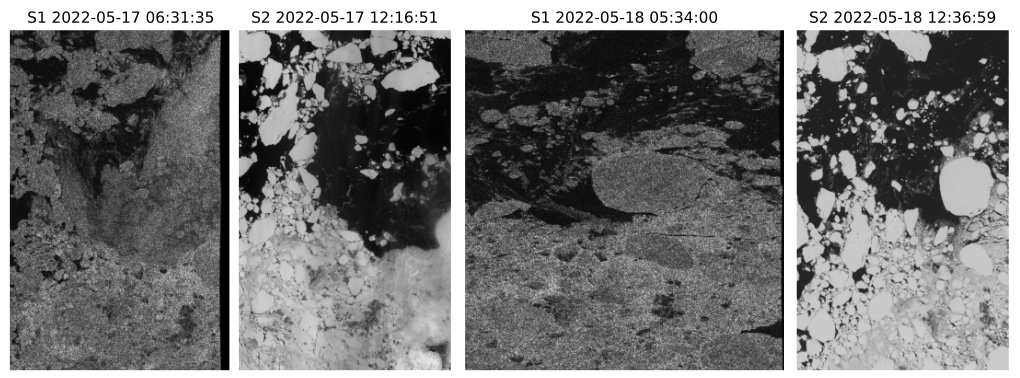
    Figure 2: Coarse co-registration between S1 EW SLC images and S2 band 3 images.

    However, sea-ice concentration is widely available at a low spatial-resolution either from manually drawn ice-chart or ASMR-2 measurements. Sea-ice concentration gives the percentage of sea-ice floes versus leads in pixels or manually drawn regions. This data can be used to produce Sea-ice concentration maps using deep-learning dataset, such as the AI4Arctic [AI4Arctic], that offer S1 GRD images linked with concentration maps. These types of data have been successfully used in deep-learning frameworks [DeGélis2021]. In this PhD, we aim to remove the probabilistic aspect of sea-ice concentration to get sea-ice floes/leads maps building on weakly supervised learning. Features extracted either from a sea-ice concentration classification task [Ahlswede2022] or a denoising algorithm such as SAR2SAR [Dalsasso2021] adapted to EW sea-ice data [Méraoumia2024], can then be used to obtain sea-ice floes/leads maps. Moreover a dataset linking S1 SLC data to concentration is being constructed in the SITEMSA. An example of a corregistrated ASMR-2 measurement and S1 EW SLC data is shown in Figure 3. This dataset would enable the use of the MERLIN denoising algorithm [Dalsasso2022] whose features have been shown to contain enough information to perform building semantic segmentation [Dalsasso2024].
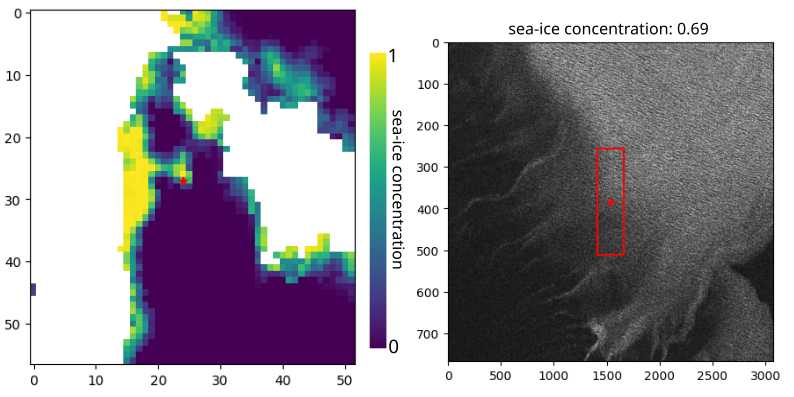
    Figure 3: Left: Concentration maps with a 3125 m sampling obtained from ASMR2 acquired the 2023-01-04 with a pixel of interest (red star) and Right: the S1 EW SLC image with the patch (red bounding box) corresponding to the footprint of the pixel of interest in ASMR2 data.

    It has already been proven beneficial in urban remote sensing to estimate the height and the classes of pixels conjointly [Carvalho2019], and optical images have already been used to densify LiDAR point cloud depth measurement [Qiu2019]. However, the challenge for sea-ice elevation is that only few measurement points will be available for supervision as shown in Figure 4, where the footprints of the altimetric measurement of the Sentinel-3 (S3) SRAL instrument are represented on their corresponding S3-OLCI visible image acquired at the same time.  The altimetric measurements could be used in an iterative framework using the existing map as coarse resolution labels to get a first training and refining it using sparse annotation [Lenczner2022].The used of the features of MERLIN could also guide the regression algorithm, as it has been done in urban areas [Dalsasso2024].
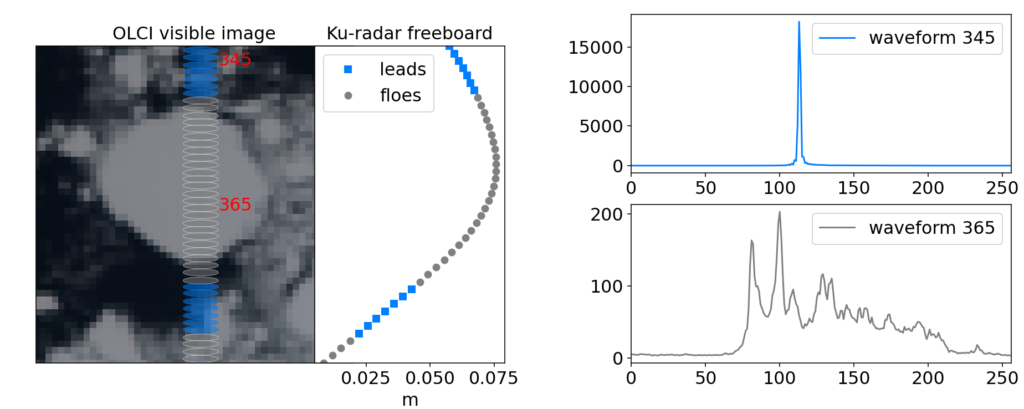
    Figure 4: The S3-OLCI visible image with the corresponding S3-SRAL altimetric acquisition and Ku-radar freeboard computed by LEGOS.

    Part of the SITEMSA project aims at measuring sea-ice drift to co-registrate SAR, optical and altimetric data. In this PhD, these algorithms could also be used to combine multiple SAR and altimetric acquisition to robustify the sea-ice elevation retrieval algorithm. Another way to combine these approaches would be to link the feature extraction in the sea-ice floe mapping, the elevation regression task and the drift measurement, to robustify the three tasks. 

    The obtained elevation maps will be validated using SWOT data. Obtaining SWOT-like data for point-like altimeters will enable us to keep the temporal depth of the altimetric measurement. This is crucial for sea-ice evolution analysis under the effect of global warming.

    Candidate profile
    We are looking for candidates with a master’s degree or the equivalent within the fields of signal and image processing and deep-learning. Good statistical skills and coding skills (python) are required. An interest in physics and climate sciences, with a focus on sea-ice, is an advantage

    References
    [AI4Arctic] Saldo, Roberto; Brandt Kreiner, Matilde; Buus-Hinkler, Jørgen; Pedersen, Leif Toudal; Malmgren-Hansen, David; Nielsen, Allan Aasbjerg; et al. (2020). AI4Arctic / ASIP Sea Ice Dataset – version 2. Technical University of Denmark. Dataset. https://doi.org/10.11583/DTU.13011134.v3

    [Ahlswede2022] S. Ahlswede, N. T. Madam, C. Schulz, B. Kleinschmit and B. Demir, “Weakly Supervised Semantic Segmentation of Remote Sensing Images for Tree Species Classification Based on Explanation Methods,” IGARSS 2022 – 2022 IEEE International Geoscience and Remote Sensing Symposium, Kuala Lumpur, Malaysia, 2022, pp. 4847-4850, doi: 10.1109/IGARSS46834.2022.9884676.

    [Carvalho2019] Marcela Carvalho, Bertrand Le Saux, Pauline Trouvé-Peloux, Frédéric Champagnat, Andrés Almansa. Multi-Task Learning of Height and Semantics from Aerial Images. IEEE Geoscience and Remote Sensing Letters, IEEE – Institute of Electrical and Electronics Engineers, 2019, ⟨10.1109/LGRS.2019.2947783⟩. ⟨hal-02386074v2⟩

    [Dalsasso2021] E. Dalsasso, L. Denis and F. Tupin, “SAR2SAR: A Semi-Supervised Despeckling Algorithm for SAR Images,” in IEEE Journal of Selected Topics in Applied Earth Observations and Remote Sensing, vol. 14, pp. 4321-4329, 2021, doi: 10.1109/JSTARS.2021.3071864.

    [Dalsasso2022] E. Dalsasso, L. Denis and F. Tupin, “As If by Magic: Self-Supervised Training of Deep Despeckling Networks With MERLIN,” in IEEE Transactions on Geoscience and Remote Sensing, vol. 60, pp. 1-13, 2022, Art no. 4704713, doi: 10.1109/TGRS.2021.3128621. 

    [Dalsasso2024] E. Dalsasso, C. Rambour, L. Denis and F. Tupin, “Learning a versatile representation of SAR data for regression and segmentation by leveraging self-supervised despeckling with MERLIN,” EUSAR 2024; 15th European Conference on Synthetic Aperture Radar, Munich, Germany, 2024, pp. 1265-1270. 

    [DeGélis2021] I. de Gélis, A. Colin and N. Longépé, “Prediction of Categorized Sea Ice Concentration From Sentinel-1 SAR Images Based on a Fully Convolutional Network,” in IEEE Journal of Selected Topics in Applied Earth Observations and Remote Sensing, vol. 14, pp. 5831-5841, 2021, doi: 10.1109/JSTARS.2021.3074068.
    [Karvonen2022] Karvonen, J. and Rinne, E. and Sallila, H. and Uotila, P. and Mäkynen, M. “Kara and Barents sea ice thickness estimation based on CryoSat-2 radar altimeter and Sentinel-1 dual-polarized synthetic aperture radar”, The Cryosphere, Volume 16, Issue 5, 222, pp 1821-1844, doi: 10.5194/tc-16-1821-2022

    [Kurtz2014] Kurtz, N. T., Galin, N., & Studinger, M. (2014). An improved CryoSat-2 sea ice freeboard retrieval algorithm through the use of waveform fitting. The Cryosphere, 8(4), 1217-1237.
    [König2020]  Marcel König, Matthias P. Wagner, and Natascha Oppelt “Ice floe tracking with Sentinel-2”, Proc. SPIE 11529, Remote Sensing of the Ocean, Sea Ice, Coastal Waters, and Large Water Regions 2020, 1152908 (20 September 2020);  https://doi.org/10.1117/12.2573427

    [Laxon2013] Laxon, S. W., Giles, K. A., Ridout, A. L., Wingham, D. J., Willatt, R., Cullen, R., … & Davidson, M. (2013). CryoSat‐2 estimates of Arctic sea ice thickness and volume. Geophysical Research Letters, 40(4), 732-737.

    [Lenczner2022] G. Lenczner, A. Chan-Hon-Tong, B. Le Saux, N. Luminari and G. Le Besnerais, “DIAL: Deep Interactive and Active Learning for Semantic Segmentation in Remote Sensing,” in IEEE Journal of Selected Topics in Applied Earth Observations and Remote Sensing, vol. 15, pp. 3376-3389, 2022, doi: 10.1109/JSTARS.2022.3166551. 

    [Méraoumia2024] https://ujm.hal.science/ujm-04720114

    [Park2020] Park, J.-W., Korosov, A. A., Babiker, M., Won, J.-S., Hansen, M. W., and Kim, H.-C.: Classification of sea ice types in Sentinel-1 synthetic aperture radar images, The Cryosphere, 14, 2629–2645, https://doi.org/10.5194/tc-14-2629-2020, 2020. 

    [Qiu2019] Jiaxiong Qiu, Zhaopeng Cui, Yinda Zhang, Xingdi Zhang, Shuaicheng Liu, Bing Zeng, Marc Pollefeys; Proceedings of the IEEE/CVF Conference on Computer Vision and Pattern Recognition (CVPR), 2019, pp. 3313-3322.[Zakharova2015] Elena A. Zakharova, Sara Fleury, Kévin Guerreiro, Sascha Willmes, Frédérique Rémy, Alexei V. Kouraev & Günther Heinemann (2015) Sea Ice Leads Detection Using SARAL/AltiKa Altimeter, Marine Geodesy, 38:sup1, 522-533, DOI: 10.1080/01490419.2015.1019655
  • Article on Labsar is out

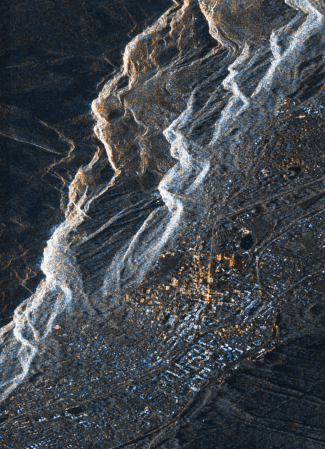
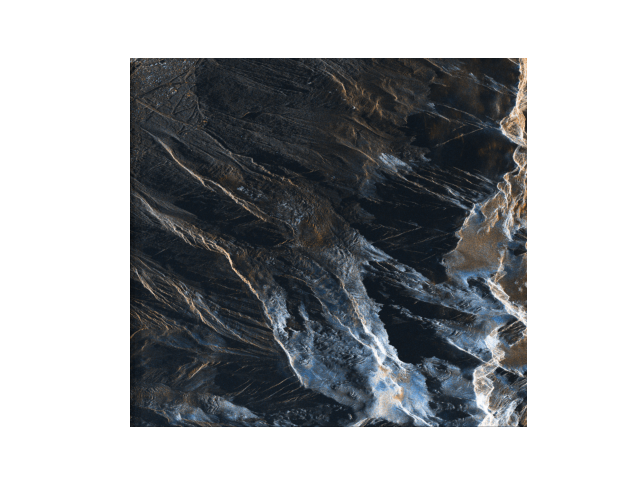
    The labsar algorithm aims to coregistrate SAR images without using a DEM. Designed by Jean-Marie Nicolas, this algorithm is easy to use and gives good results for both interferometry and mouvement estimation. For this article, I tested the interferometric performances of Labsar while Laurane Charrier and Cyril Thomas verifies the mouvement estimation. We worked on the very beautiful PAZ images over the Chamonix area and the Bosson glacier. Help by Jean-Marie, we tried to explain the methodology as clearly as possible. I was very happy to write this article with this nice team, and especially with Laurane.

  • Congratulation to Dr Simon Erdmann

    Simon defended is PhD in Toulouse in February 2022, with most of his jury being remote due to COVID19 constraint. ISAE defense room was equipped with video and sound devices making it confortable despite the constraint. It was my first jury and I was very stressed, but Simon gave a good presentation with very didactic explanation on speckle and on his work. I was also happy that he got interesting comments from the jury members that lead to a good discussion.

    Simon worked on the use of an ultra fast camera to detect microvascularisation patterns using dynamic speckle. He showed through the study of various image series and simulation that the coefficient from the temporal autocorrelation have better detection capacities than the contrast. If you want to know more on Simon’s work, his article was out few weeks after his defense.

  • 2nd place, Ph.D. Award 2016 of Telecom ParisTech

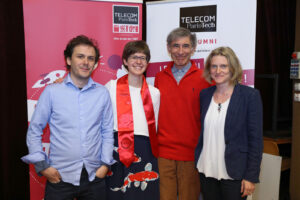
    The 2016 PhD graduation ceremony of Telecom ParisTech was held on the 21 April 2017. It was a great pleasure to graduate with some of my PhD friends: Sonia, so many nice memories. All my PhD supervisors also came to this event which was immortalised by a nice photo.


    The graduation started with the Telecom ParisTech Ph.D. Award ceremony. This award recognises the scientific quality, the innovation and social impact potential of the research performed during the PhD at Telecom ParisTech.
    I was a finalist and had to give a 5′ pitch. It was a difficult exercice but very interesting to summarise my PhD work and make it audible to the large audience.
    The pitch has been recorded and his available on youtube.

  • Presentation of my PhD work in video

    In the fall 2017, I was invited to give a presentation at the Research Day of the LTCI lab at Telecom ParisTech. It was a great occasion to meet my ex-colleagues and discover the hot topic of the other researchers. I would like to thank Etienne Borde that invited me and dealt with all the administrative work.

    As a speaker, I was interviewed on the work I presented, which mainly focused on the Eiffel Tower deformation. The interview was filmed and the result in now available on youtube. The interview is in French and subtitles are only in French for now but should be translated in English soon.

    Thanks to Henri Maitre, who interviewed me, Michel Desnoues, who filmed the interview and edited it, and Alexia Kappelmann, who organised everything, edited part of the video and inserted the slides. It was a real pleasure to work with you!

  • CryoSat 2017: first CryoSat conference and first CPOM blog post

    The first North American CryoSat Science Meeting was held in Banff, in the beautiful Canadian Rockies.

    As it was my first conference linked to my post-doc (which in on the swath processing of CryoSat-2 SARIn products), I learn a lot about the satellite, the processing done to create the L1b product, the retracker and all the applications achieved thanks to the satellite acquisitions. It was also the occasion to hike and snowshoe with researchers from all over the world.

    More information on the scientific question raised during the meeting and on follow-on mission can be found in my first CPOM blog article.

    http://cpom.org.uk/first-north-american-cryosat-science-meeting-news-follow-mission/

  • Mission accomplished: PhD Defense completed

    First was the travel. My PhD Defense was hold on Friday the 29th of November. This was a cold but sunny day, with nearly no train or RER delays. The car-travel to Telecom ParisTech with the food for the cocktail was a bit stressful. But I eventually arrive widely on time.

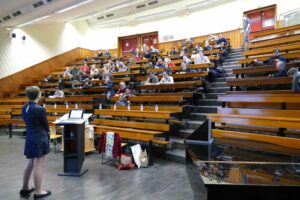
    Then was the Defense. I really enjoyed going through this experience supported by my family, my friends and my numerous colleagues. Their smiles in the amphitheater and their kind encouraging messages helped me overcome my initial nervousness. My defense would not have been the same without the jury and their challenging questions. I want to thank them for their careful reviews of my work that open a lot of new research axes. Definitely, a PhD is never really finished.

    Finally were the parties! The cocktail that followed the defense was really fun. Lots of kind words were written on the table by my sister and the colleagues that set up everything. I did not have the time to discuss to everybody, but we could follow up on Saturday night! I really want to thank all my friend that came from all over France for this party.

    Amphi

  • ODAS, sunrise at the DLR Oberpfaffenhofen

    The ONERA-DLR Aerospace Symposium 2016 (ODAS) was hold in the DLR facilities in Oberpfaffenhofen.

    It was the occasion of great exchanges between the ONERA and DLR remote sensing team. I learned a lot on the TerraSAR-X and TanDEM-X data acquisition and processing. I discussed with many DLR researchers and ONERA colleagues from different centers. Among them, I want to thank Thomas Kraus for his explanations on the Dual-Receive Antenna mode constraints and Andreas Schmitt for the discussion on how to handle data from different sensors in Pol-Sharpening algorithms.

    The DLR had also organized a visit of its facility. I really enjoyed discovering the different research aircrafts and the radar anechoic chamber. All the guides were so enthusiastic!

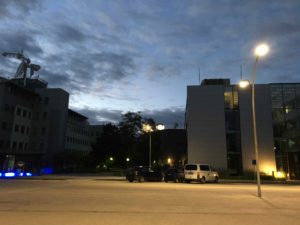
    The launch of one of the Firebird satellite occurred during ODAS. We had the opportunity to follow it in The German Space Operations Center with the teams that worked on the satellite. Even if all the presentations were in German, it was a great experience. The launch was in India at 05:55 CEST. It was thus the occasion to see the DLR center nearly by night.

    IMG_1235

  • EUSAR 2016 Student Award: first place

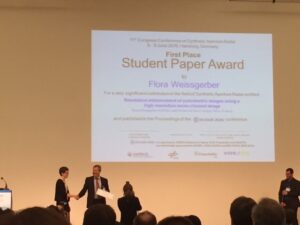
    My article entitled “Resolution enhancement of polarimetric images using a high resolution mono-channel image” won the first prize of the EuSAR 2016 Student Award. The work presented in this article was the extension of the work I presented in POLinSAR 2015.

    This article deals with the main goal of my PhD which is the merge of high resolution single-pol image and quad-pol images acquired with the same sensor in interferometric condition in order to produce high resolution quad-pol image. The polarimetric features of the scatterers have to be preserved as well as the interferometric capacity of the initial quad-pol image. Our goal is thus to preserve the power of the polarimetric channel but also its phase. A spectral approach based on the spectral properties of white and isotropic point-like scatterers has been chosen. The pixels of the images are thus modeled as the sum of the point-spread fonction of point-like scatterers, which can be approximated as a cardinal sine in both direction, and a fully developed speckle, dominating in homogeneous areas.

    In this article, two spectral algorithms are presented. The first one, called the sum method reconstruct better the point-like scatters but correlated the polarimetric channel in homogeneous areas. On the other hand, the algorithm called the center-point method preserves better the speckle properties. These two algorithms are merged, based on a point-like scatterers and bright lines detection.

    The results are illustrated on images acquired over Salon de Provence by ONERA’s SETHI sensor and images acquired over Amsterdam by TerraSAR-X. In order to process these real data, preprocessing such as the spectrum unwrapping and unweighting are also needed. These preprocessings are implemented in order to deal with data acquired by different sensors with various resolution ratios.

    The final processing chain is a versatile tool to create high resolution polarimetric images from polarimetric images and a high resolution mono-channel images.

  • Corner reflectors on the Eiffel Tower

    Corner reflectors designed for radar are targets that reflect the wave emitted by the satellite back to the antenna. The combined reflections on the 3 mirors redirect the waves in their original direction and it can be demonstrated by simple math. We can decompose the propagation vector of the wave k in the 3-dimentionnal basis make by normal to the 3 mirors, n1, n2 and n3 : k=a1.n1+a2.n2+a3.n3 . The optical law of reflection that we can use in radar says that the reflection on the miror 1 will change the sign of the composante n1 of the vector k: k’=-a1.n1+a2.n2+a3.n3 . After the reflection on the second miror, the composante n2 will change sign: k”=-a1.n1-a2.n2+a3.n3 and after the reflection on the last miror, k”‘=-a1.n1-a2.n2-a3.n3 = -k . In conclusion, after the three reflections the wave that leaves the corner reflector go in the opposite direction that the wave that entered in the corner reflector and thus go back to the antenna.

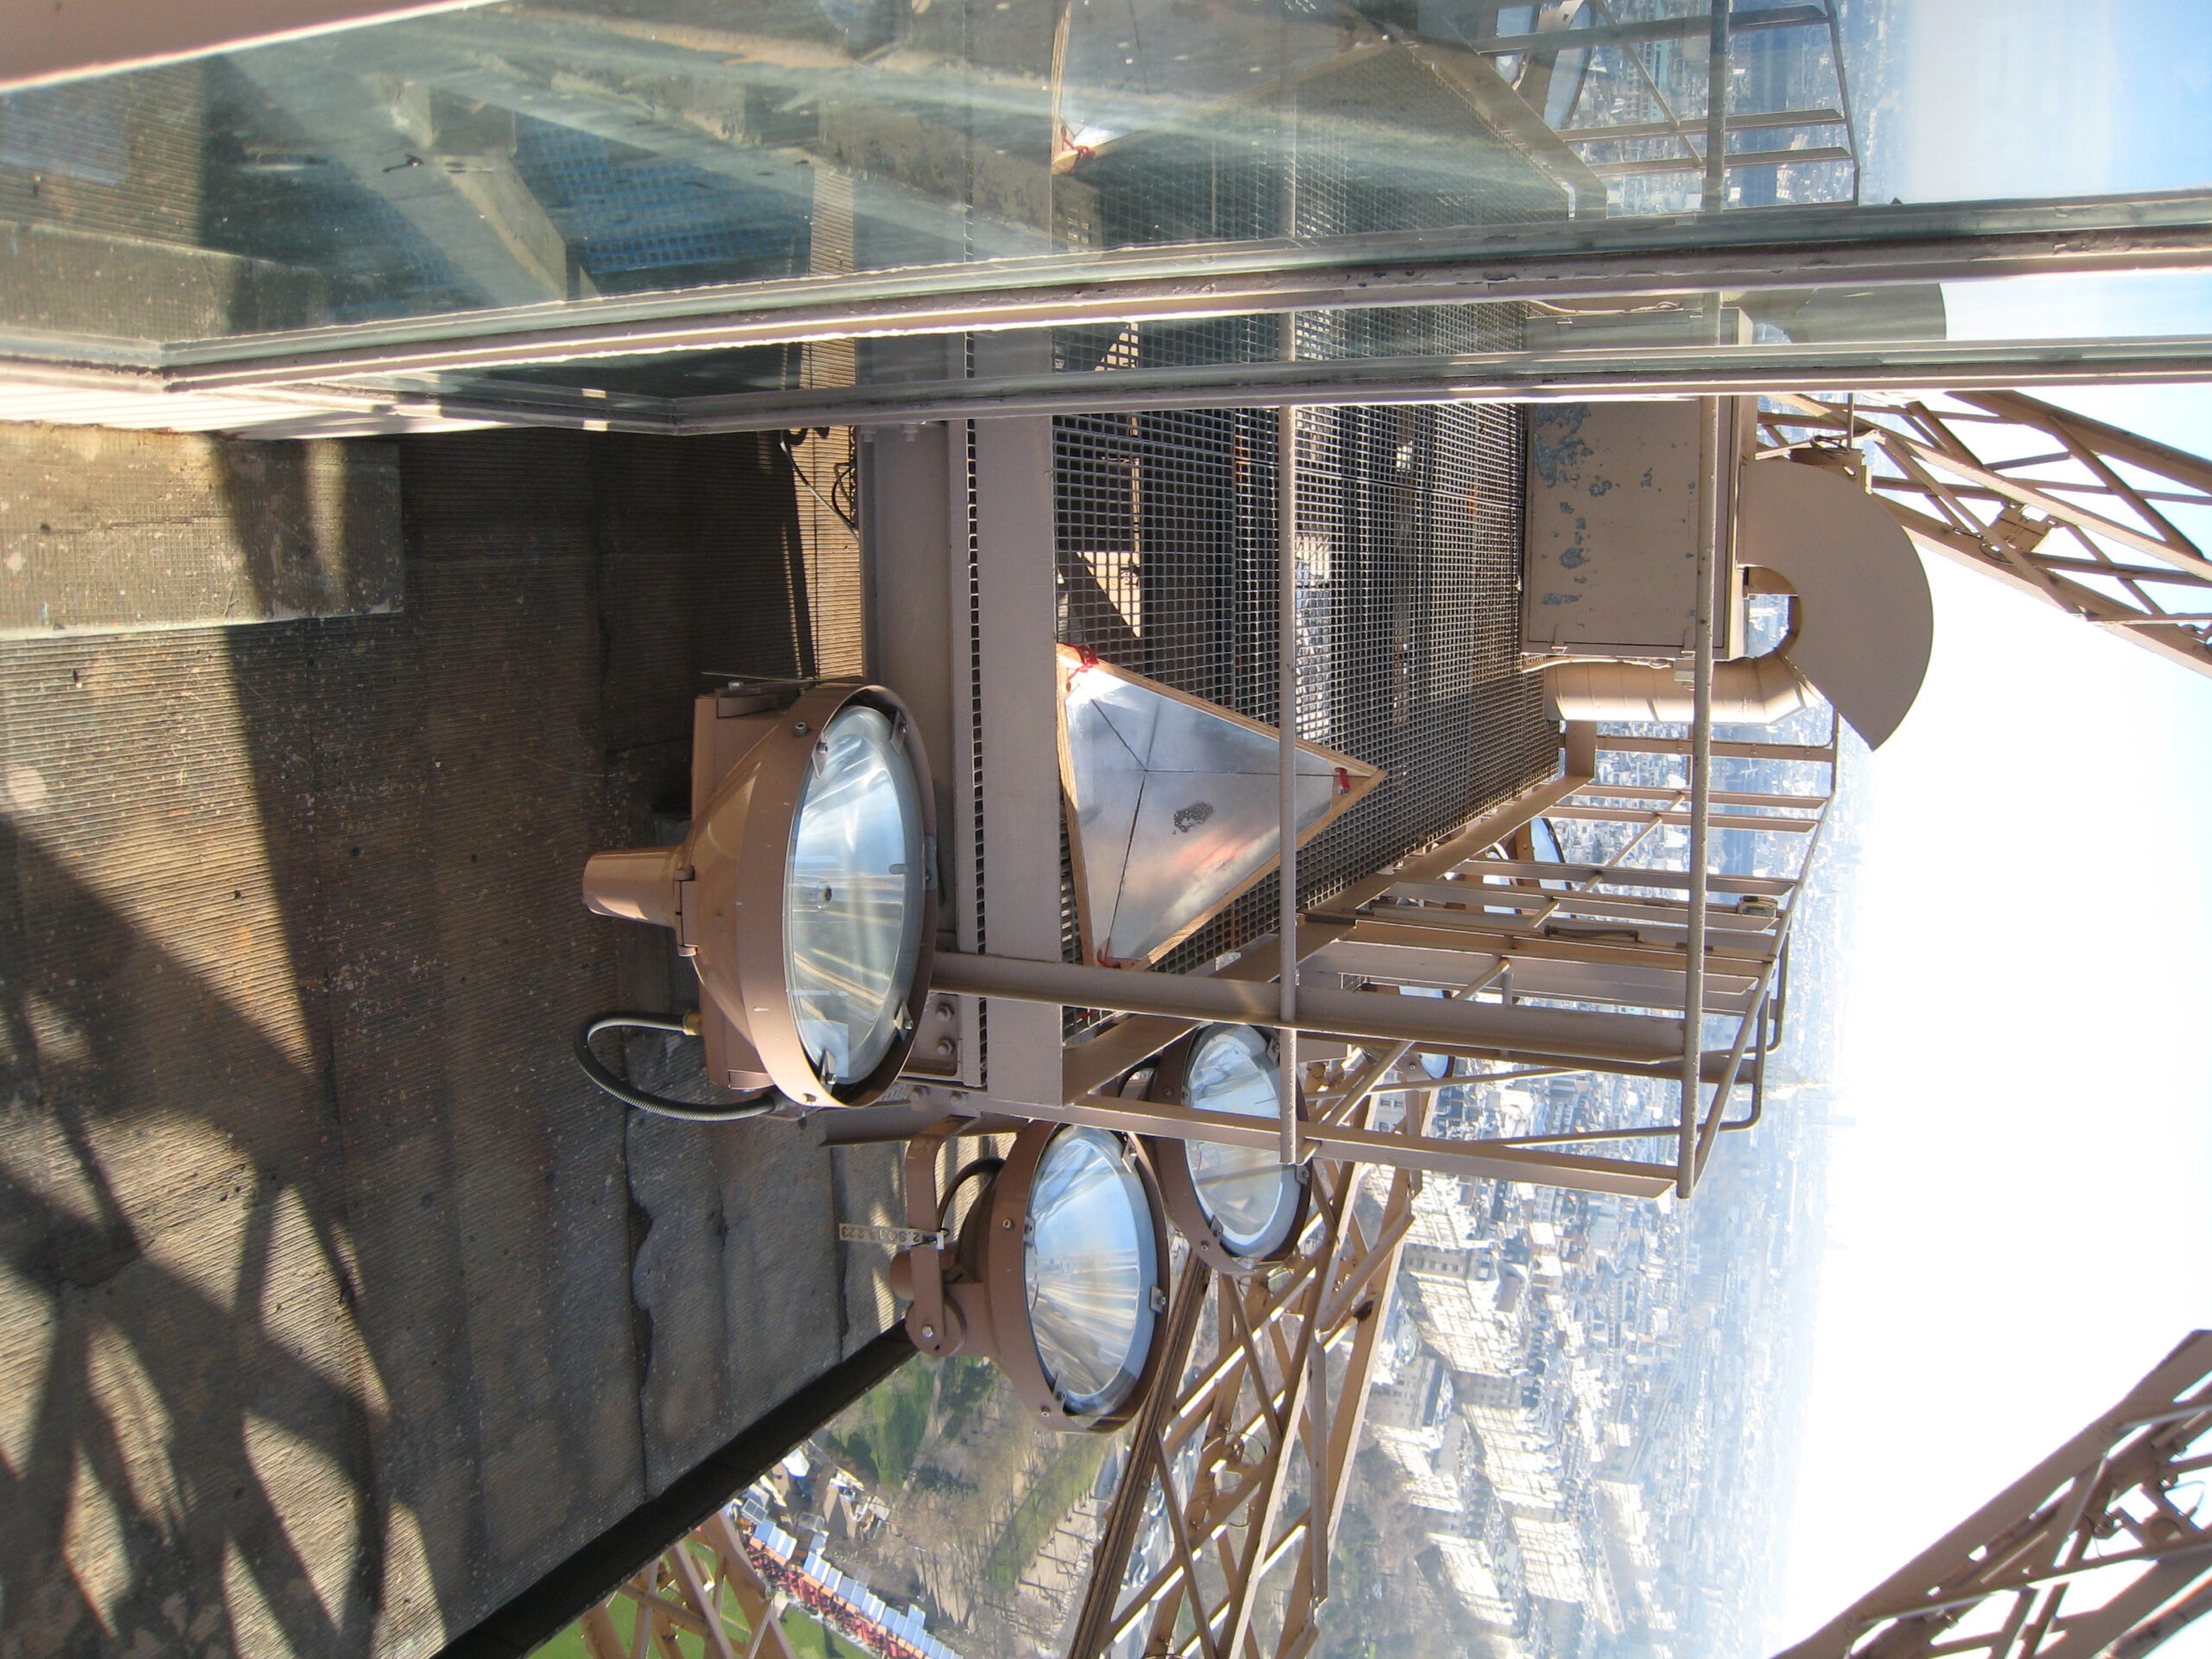
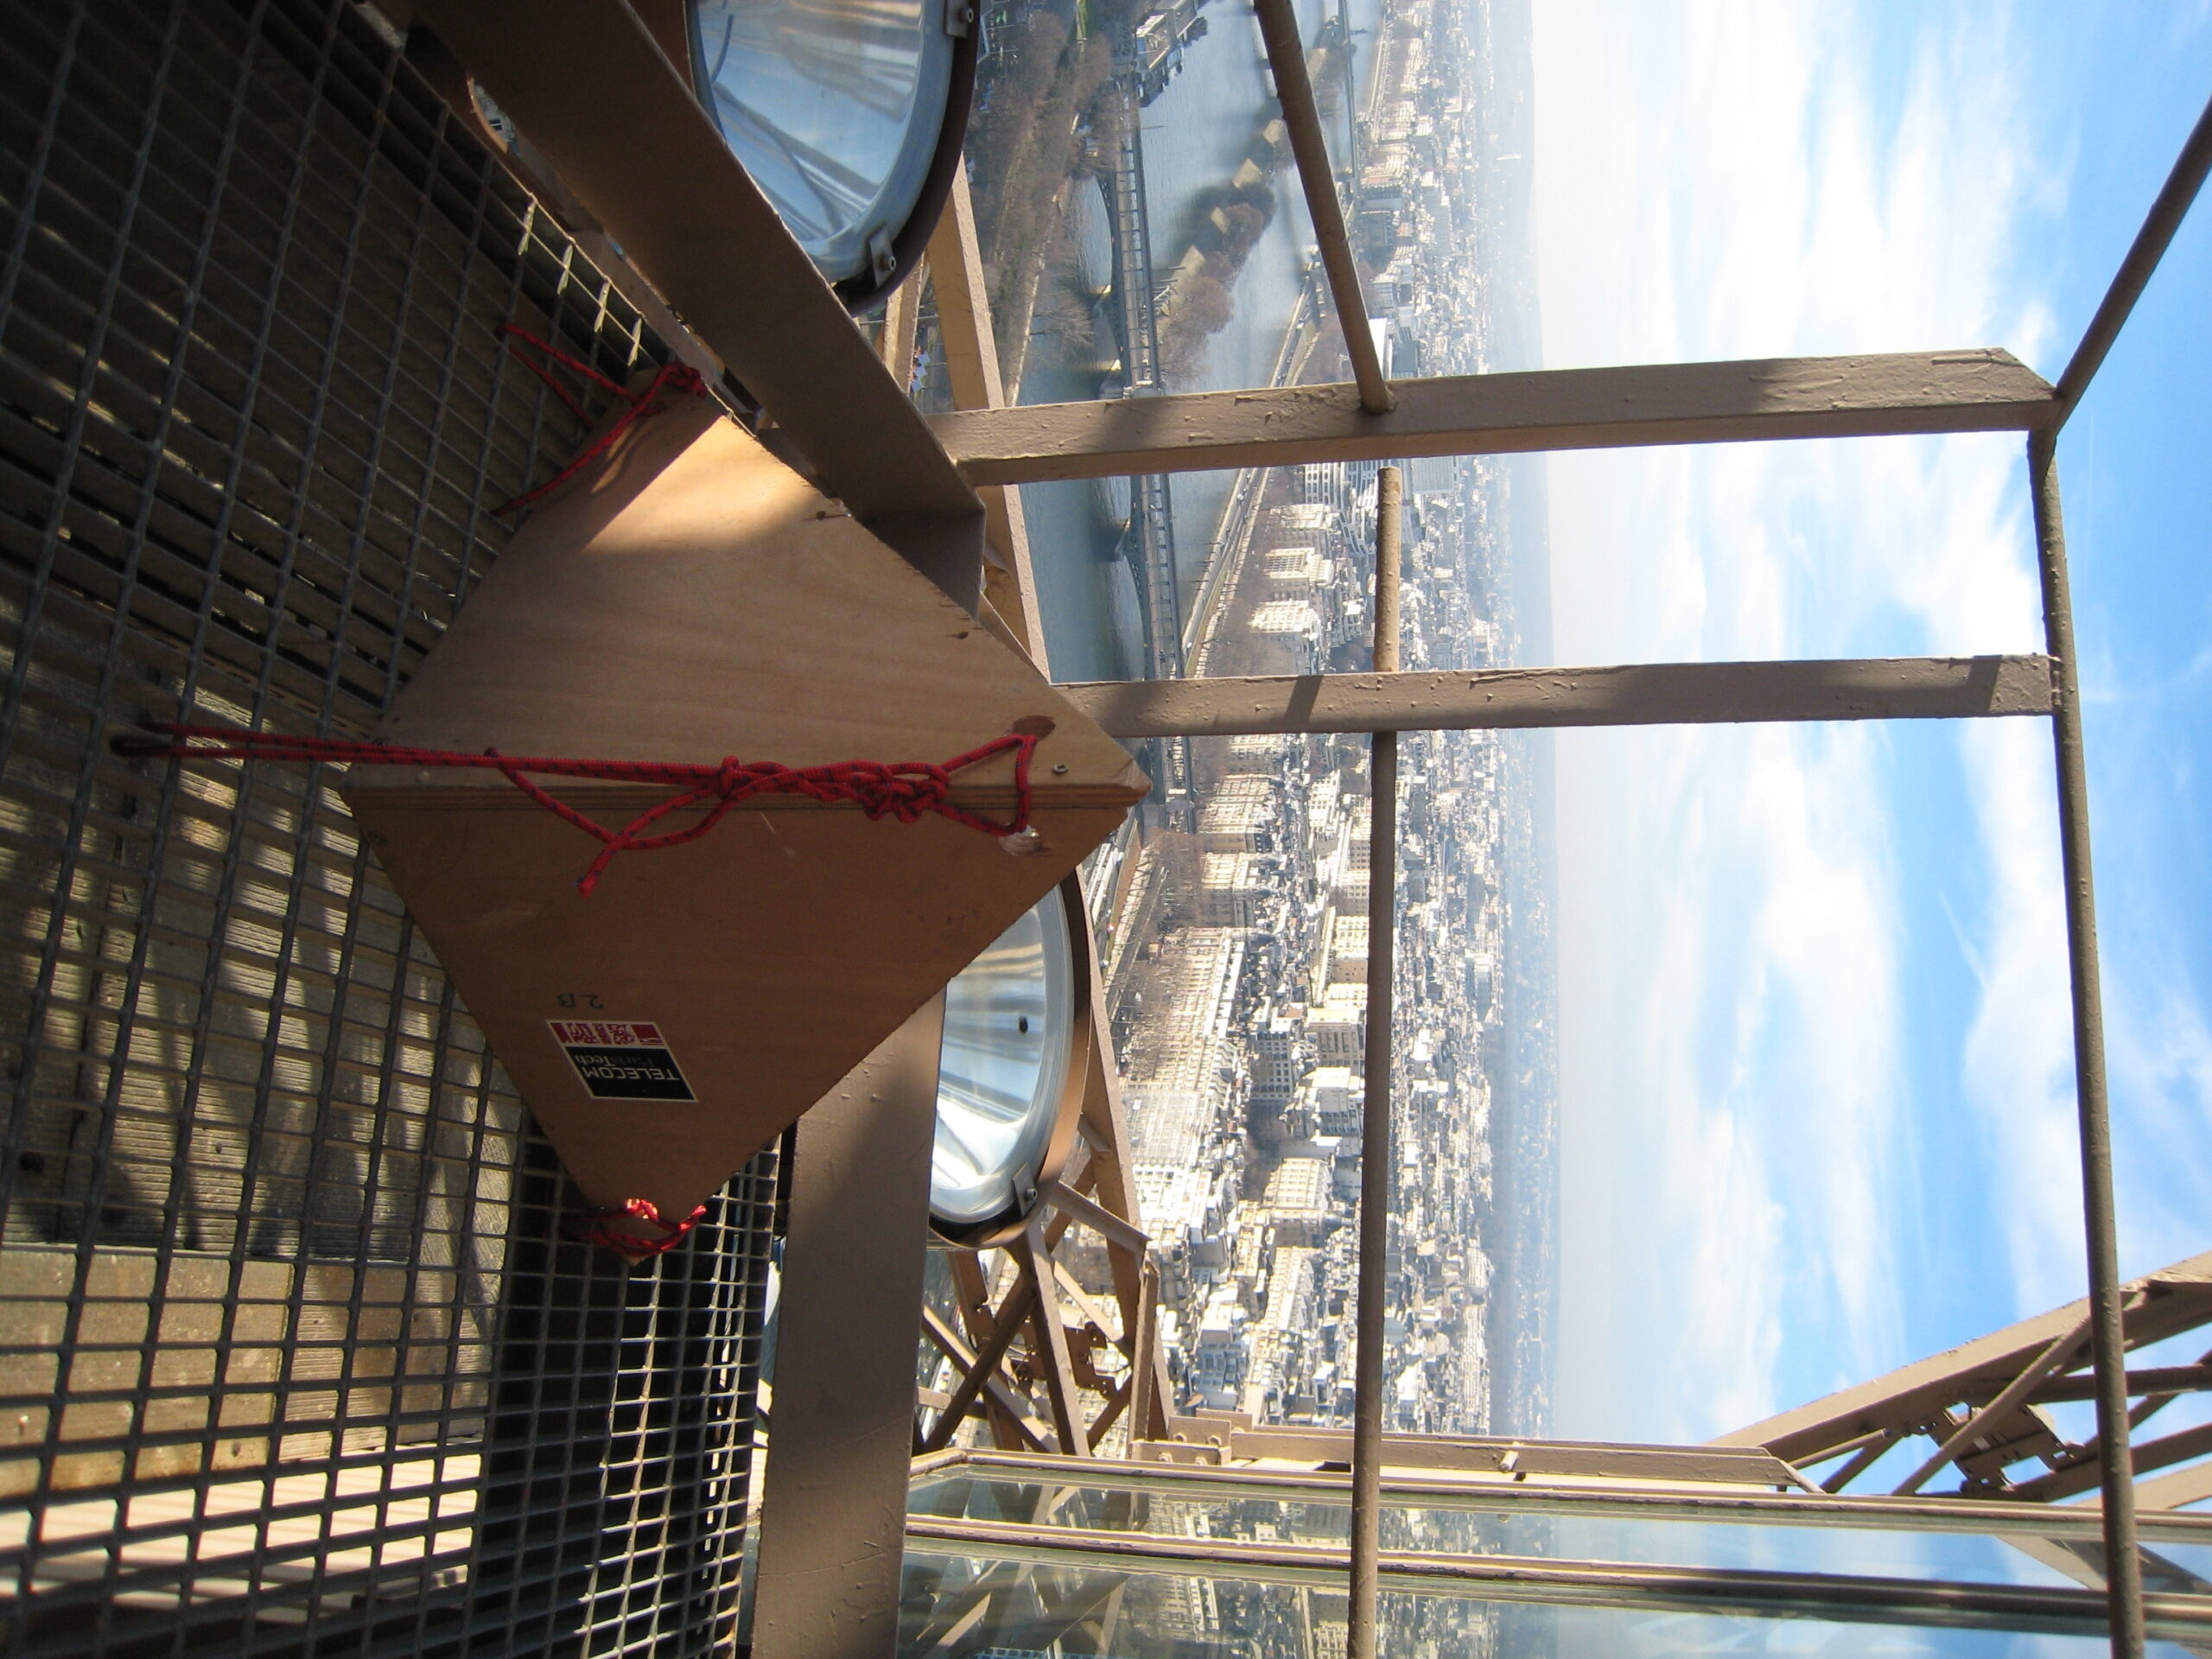
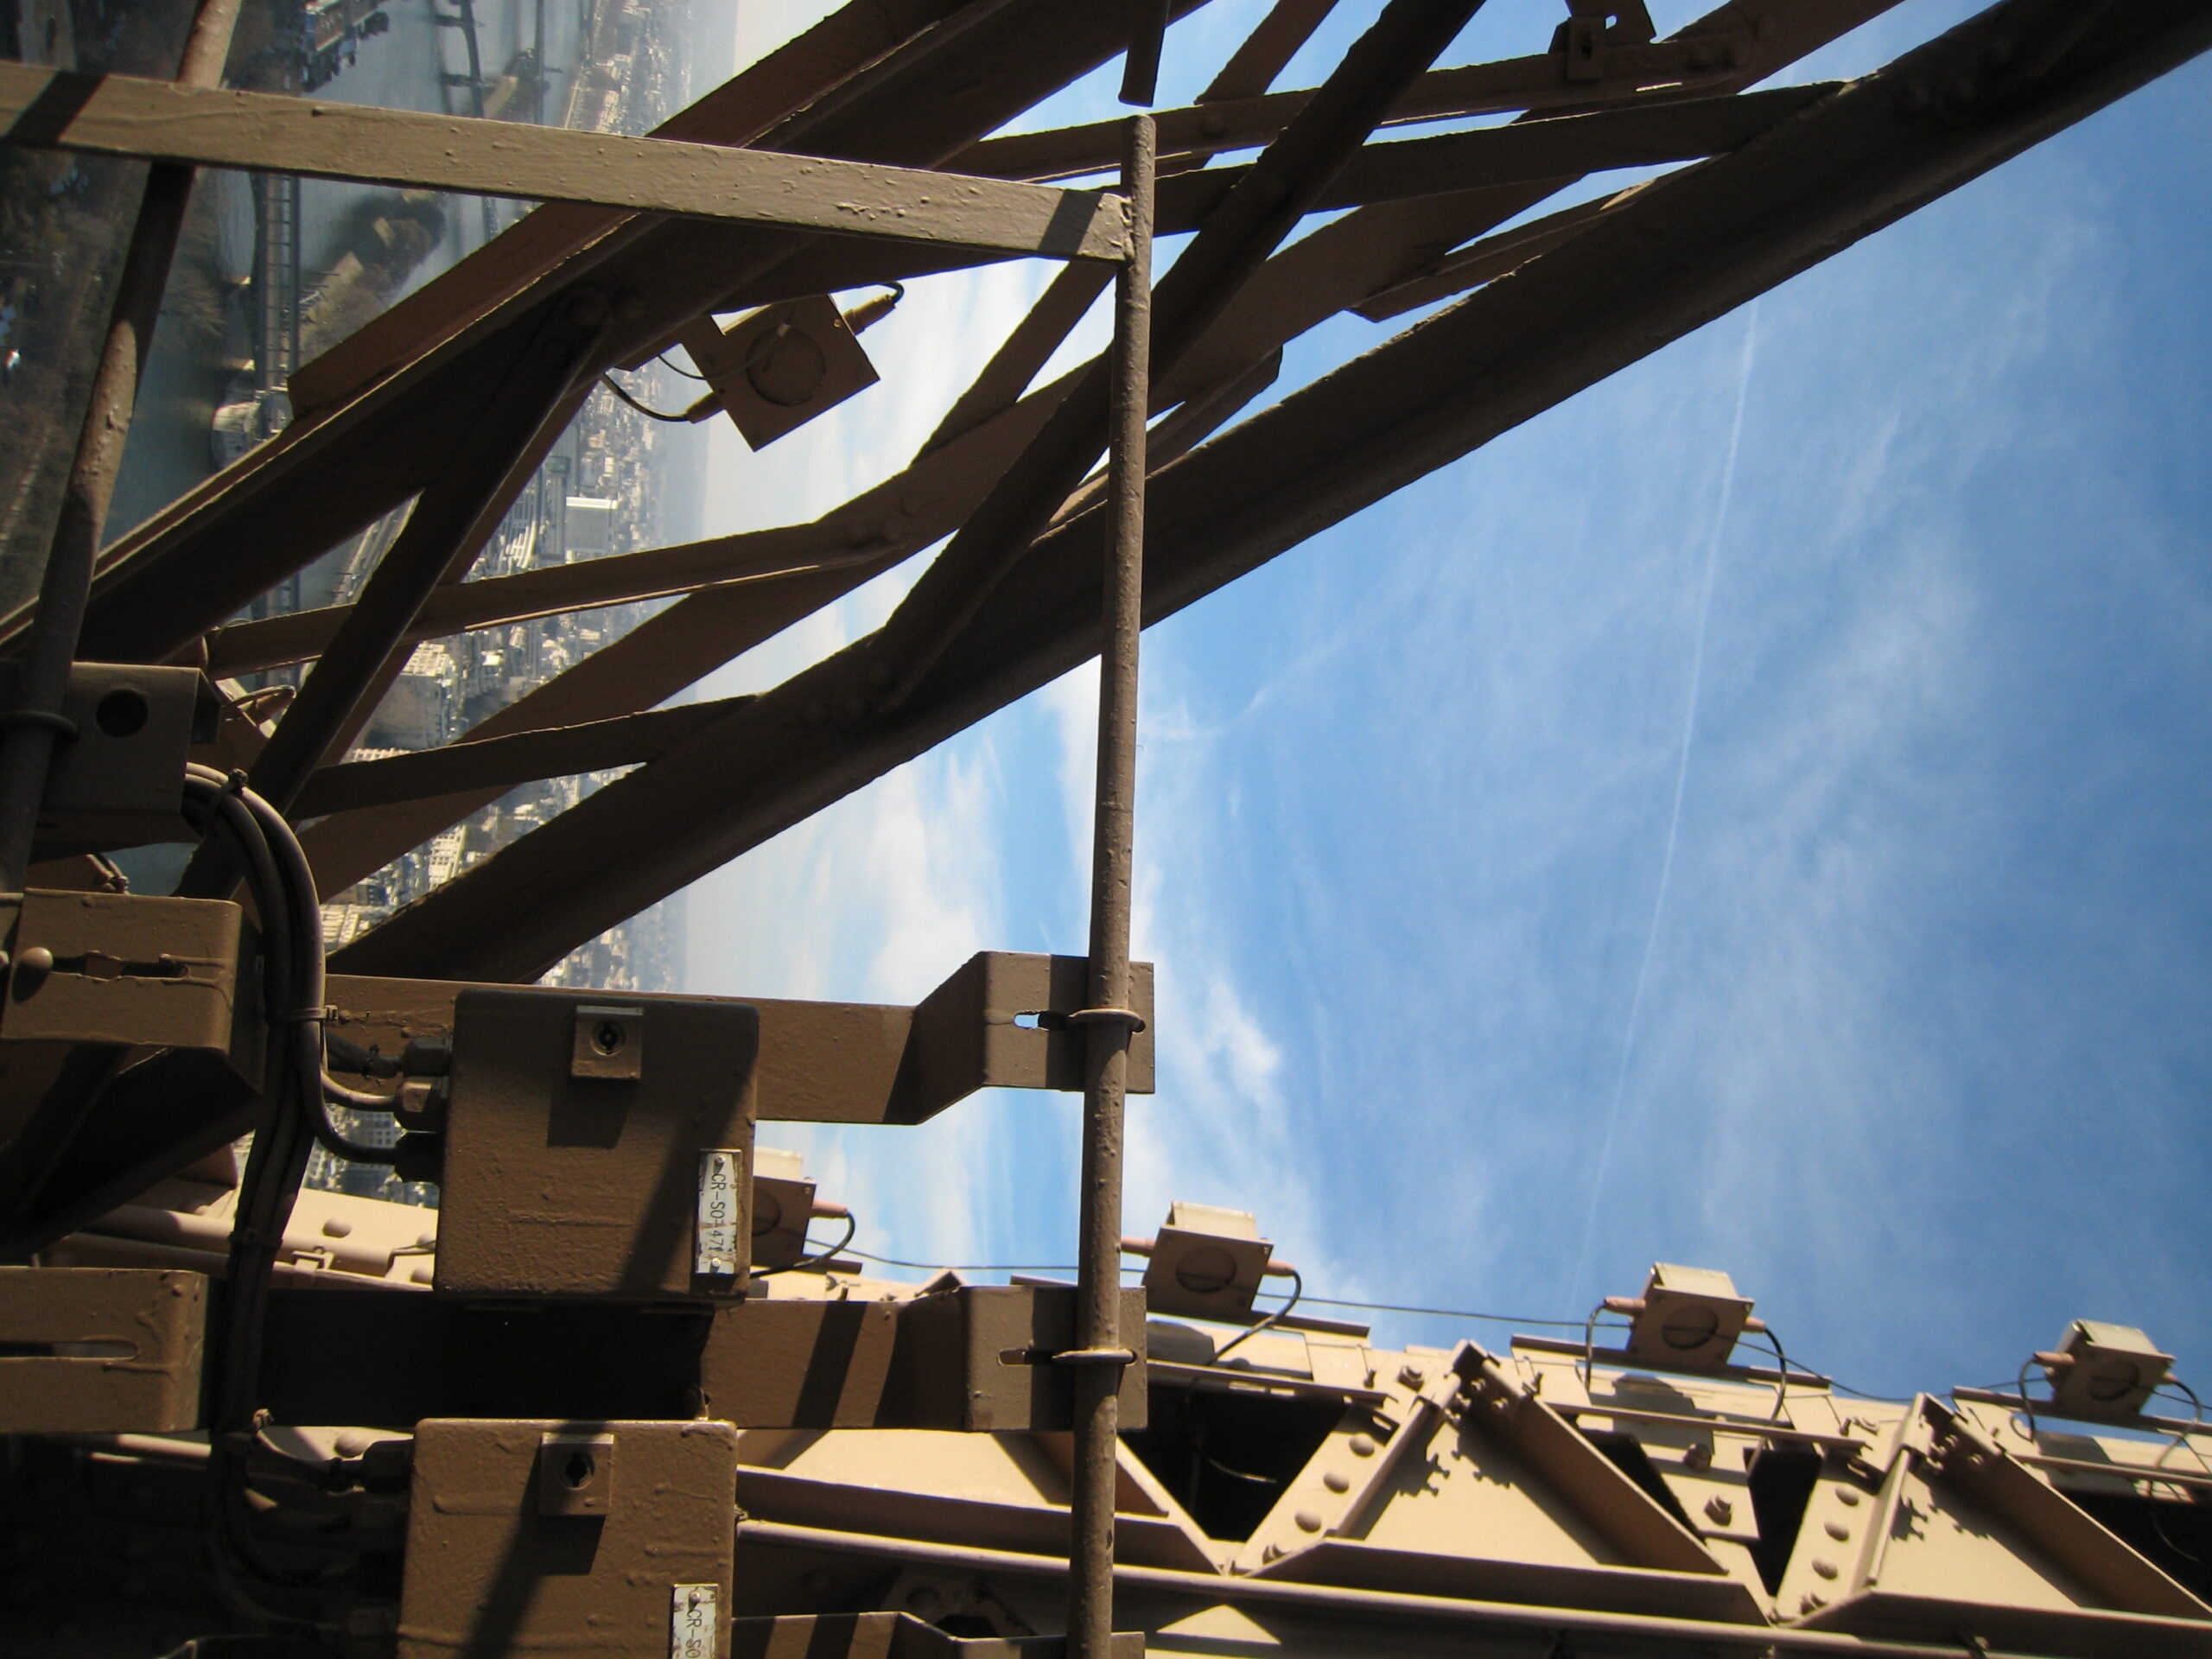
    For our experience on the Eiffel Tower, we put 2 corner reflectors above the restaurant “Jules Vernes”, located at the second level on a platform which we know the altitude. The corner have been on the Eiffel Tower for nearly two month, during the new TerraSAR-X and TanDEM-X acquisitions over the city. We are now waiting for the delivery of the images. Then, when we locate them on the images, they  serve as reference for the height measurment that will allow us to have a precise deformation measurment.

    IMG_2297 IMG_2300
    The first corner and its view
    IMG_2298 IMG_2299
    The second corner and its view.